


Overview Page
Use overview insights to track performance and activity.
The Overview page is where you step back and see what’s happening across your work.
While the Home page focuses on what needs to be done, and the Library page is where your work is stored, the Overview page helps you spot patterns, track progress, and understand how things are changing over time.
The overview screen
At the top of the page, you’ll see a large visual area where your data will be displayed.
When you first open the page, this area may be empty. It’s ready to show your data once you choose what you want to look at.
Data controls
Below the visual area, you’ll find the controls that determine what is shown.
Here, you can:
- Select a resource, such as Leads, Posts, Messages, or Appointments
- Choose how the data is displayed
- Select an attribute if you want to focus on specific values
As you make changes here, the visual area above updates to reflect your selections. This allows you to explore your data in different ways.
Line graphs
Line graphs show how things change over time.
This is useful for spotting trends, such as how many leads you’re generating or how your activity is increasing or decreasing.
For example, you might use this to see how many leads you’ve created each week, or how your posting activity has changed over the past month.
Timelines
Timelines show your objects laid out across time.
This lets you see how work is scheduled and how different items overlap.
You can also work directly from this view. You can right-click on the timeline to create new objects, and you can move existing objects to reschedule them.
For example, if you view your posts in a timeline, you can see your publishing schedule, rearrange upcoming posts, and add new ones in the right place.
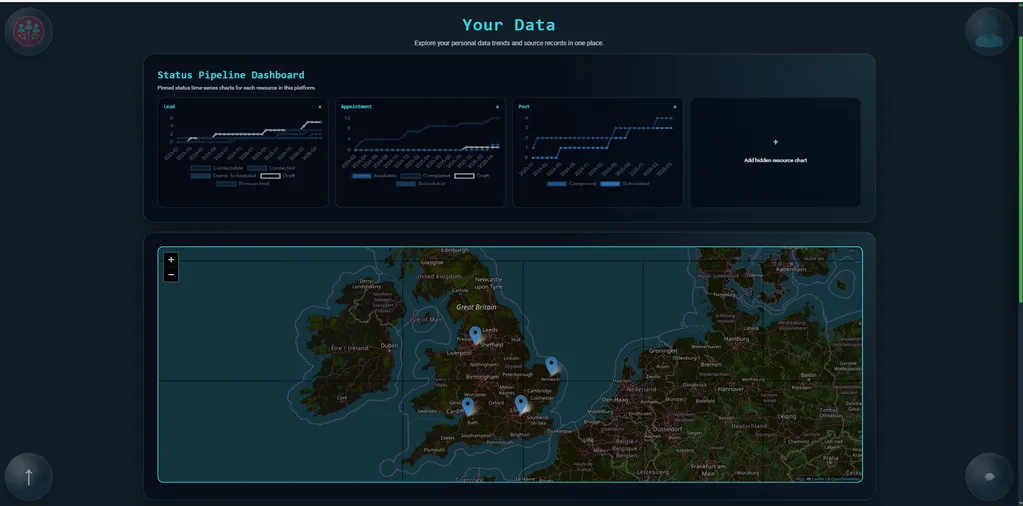
Maps
Maps show where your data is located.
This is useful when location matters, allowing you to see how your data is spread across different areas.
You can click on the points on the map to open the related objects directly in the Resource Viewer.
For example, if you view your leads on the map, you can see where they are distributed geographically and quickly open specific leads from the map.
Filtering your view
You can adjust what data is included.
The user and company toggle controls whether you are looking at your own data or the wider team.
Additional filters let you narrow things down further, so you can focus only on what’s relevant.
Looking at the detail
Below the visual area, you’ll also see a table with the underlying data.
This shows the individual objects behind what you’re seeing above. You can use it to look more closely at specific items or apply more detailed filters.
If you click on a row, it will open that object so you can move from reviewing data back into working on it.
Summary
The Overview page helps you understand what’s happening across your resources.
It gives you a clear view of trends, activity, and performance, and lets you explore your data by choosing how it’s displayed.
Read next: Chat
Continue to Chat.